



This guide is for support leads and CX managers who need clear numbers on how customers feel, not just a gut sense. It walks through each customer satisfaction KPI worth tracking, how to calculate it, and what to do with the results.
TL;DR
- Customer satisfaction metrics only help when you track the right ones and act on what they show.
- CSAT, NPS, and CES tell you how customers feel, while churn and lifetime value show what that feeling is worth.
- Speed metrics like first response and resolution time often explain a sudden dip in your satisfaction scores.
- A simple tracking routine beats a dashboard full of numbers nobody reads.
Poor customer service is a loyalty breaker for 47% of consumers, according to the SAP Emarsys Customer Loyalty Index 2025. That puts service quality right next to price and product as a reason people switch brands.
That’s why understanding the impact of service quality isn’t just important, it’s business-critical. When customer expectations shape every business decision, companies need to stay close to the customer journey.
By keeping track of customer satisfaction KPIs (key performance indicators), you can find pain points, improve service delivery, and build stronger loyalty and customer retention.
Customer satisfaction gives you benchmarks for how well you’ve met your audience’s expectations. Collecting feedback lets you review these support metrics and spot the touchpoints that need attention to improve the overall customer experience.
The bottom line is that higher customer satisfaction means a more sustainable, profitable business. That’s why tracking the key metrics for customer satisfaction isn’t just helpful, it’s essential. Let’s break down why they matter.
Why Tracking Customer Satisfaction KPIs Matters
Tracking customer satisfaction is essential for long-term success, since it gives you measurable insights that shape and improve your support strategy. Watching the right customer KPIs keeps quality high, and the steps you take based on them lead to tangible outcomes.
Identifying Areas of Improvement
Methods like customer surveys help you understand how customers feel about your products or services. This feedback lets you build on your strengths and improve weaker areas.
Stronger Customer Retention
Keeping an existing customer usually costs far less than winning a new one. That makes customer retention an actionable goal and a step toward stronger loyalty.
There are various customer retention strategies your business can use, including personalized experiences, loyalty programs, and continuous engagement.
Improved Customer Loyalty
Loyalty is earned when customers keep choosing your product or service, and that can change quickly. As the Emarsys data above shows, a poor service experience is one of the most common reasons customers walk away.
Reduced Customer Churn
Churn is the rate at which customers stop buying your products over time, which makes it a key customer KPI. A rise in churn often follows a drop in satisfaction scores, so it pays to watch the two side by side.
Gaining a Competitive Edge
By setting your brand apart from the rest, your business gains a significant competitive advantage against similar companies in the sector.

Top 10 Customer Satisfaction KPIs to Track
Customer satisfaction is essential, but knowing how to measure it is where many businesses struggle. The right KPIs turn vague impressions into actionable insights. Below are ten customer satisfaction metrics examples, each with a formula you can use right away.
1. Customer Satisfaction Score (CSAT)
Broadly explained, a CSAT score measures a customer’s satisfaction with the company, products, or services, helping you monitor overall sentiment and pinpoint areas for improvement.
Companies usually collect CSAT data through customer surveys that ask about satisfaction with a recent experience.
CSAT can be measured through the following formula:
CSAT = (Number of satisfied responses / Total number of responses) x 100
What counts as a good score varies from industry to industry. For reference, Amazon, Nordstrom, and Chewy tied for the top spot among online retailers with a score of 82 out of 100 in the ACSI Retail and Consumer Shipping Study 2026, while Costco scored 81.
To improve CSAT levels, you can use these simple strategies.
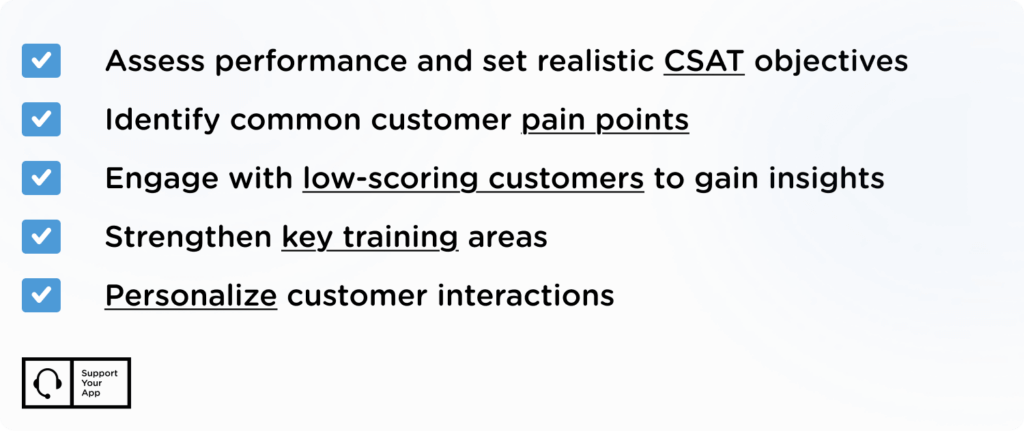
By consistently applying these strategies, you can turn feedback into meaningful improvements. Over time, even small changes can lead to stronger customer relationships and higher satisfaction scores.
2. Net Promoter Score (NPS)
NPS remains one of the most popular customer satisfaction indicators for measuring customer loyalty, with one important question:
“How likely are you to recommend our business/product/service on a scale of 0-10?”
Over time, NPS can help improve the customer experience as a whole by showing how loyal your customers are. To calculate this value, split the scores into three categories:
- Promoters: 9 and 10, your most loyal customers
- Passives: 7 and 8, customers who stay neutral but can become promoters with some fostering
- Detractors: 0 to 6, customers least likely to promote your brand
The score can then be determined with the following formula:
NPS = % promoters - % detractors
But how do you increase this score? NPS needs consistent work to improve. Ways to do so include:
- Act on customer feedback
- Introduce loyalty programs to encourage loyal customers to promote your brand
- Share NPS surveys regularly on your website or via other channels
3. Customer Effort Score (CES)
Another popular choice among key metrics for customer satisfaction is CES, which evaluates how easy it is for a customer to complete a specific interaction with your company. It helps identify friction points across touchpoints and improve the overall experience.
If customers find tasks like making a purchase or contacting support too difficult, they’re likely to drop off. Simplifying these processes improves satisfaction and lifts your CES score.
CES is usually measured through a post-interaction survey, where customers rate how easy the experience was on a scale such as 1 to 7. The score is then calculated using the following formula:
CES = Sum of all scores / Number of responses
Gartner’s research on effortless service found that effort has the strongest tie to customer loyalty, which makes CES a more reliable loyalty predictor than CSAT or NPS on their own.
4. Customer Churn Rate
Closely linked to CES, churn rate measures how well your company keeps its customers. When interactions take less effort, fewer customers leave.
Churn Rate = (Customers lost during a period / Total customers at the start of the period) x 100
A consistently low churn rate signals strong customer satisfaction and long-term brand trust.
5. First Contact Resolution (FCR)
FCR leans heavily into the customer support side of the business, measuring how well your team resolves issues the first time a customer makes contact. It can be calculated as follows:
FCR = (Number of issues resolved on first contact / Total issues) x 100
When customers get their answer on the first try, satisfaction goes up. High FCR also cuts operational costs by reducing repeat contacts and escalations.
One way to keep FCR high is by outsourcing your customer service. At SupportYourApp, our consultants get regular training in customer support and effective issue resolution across channels, so your FCR stays high.
The level of customer service you provide matters here too. The weaker your support, the less inclined customers are to buy from you or stay loyal. Determine what customer service level your business offers and how you can improve it.
6. Customer Lifetime Value (CLV)
How much value does every customer bring to your business? CLV answers that by counting every purchase a customer makes toward their total value. It can be calculated as follows:
CLV = Average purchase value x Number of purchases across the customer journey
A high CLV points to a regular, loyal customer, while lower-value customers are often one-time buyers lost to churn. Monitoring these values helps you grow overall revenue and reduce churn over time.
7. First Response Time (FRT)
FRT measures how long a customer waits before your team sends the first reply. Slow first replies are one of the fastest ways to frustrate someone who already has a problem.
FRT = Total time to first reply / Number of tickets
AI can speed this up without taking people out of the loop. Teams using SupportBrain send first replies 40% faster, because the AI drafts each answer and an agent reviews it before it goes out.
8. Average Resolution Time (ART)
ART tracks how long it takes to fully resolve an issue, from the first message to the final fix. A fast first reply means little if the problem drags on for days.
ART = Total resolution time for all tickets / Number of resolved tickets
Routine requests are where automation pays off fastest. Cocoatech came to SupportYourApp when its chat queue kept falling behind. After an AI agent took over routine chats, it handled 81% of chat volume, and average resolution time dropped from 8+ hours to 5 minutes, as the Cocoatech case study shows. An autonomous AI agent like SupportResponse works the same way, resolving routine chats and emails 24/7 and escalating complex cases to a human agent.
9. Customer Retention Rate (CRR)
While churn shows who leaves, retention rate shows who stays. It’s one of the clearest signs that customers are happy enough to keep doing business with you.
CRR = ((Customers at the end of a period - New customers acquired) / Customers at the start of the period) x 100
A steady or rising CRR usually means your product and support are meeting expectations. A sudden drop is a signal to check your other satisfaction scores for the cause.
10. Repeat Contact Rate
This metric shows how often customers come back about the same issue within a set window, such as seven days. A high rate usually means answers aren’t sticking or problems aren’t fully solved.
Repeat Contact Rate = (Customers who contact you again about the same issue / Total customers who contacted you) x 100
Pair it with FCR. If both move in the wrong direction, your team likely needs better knowledge base content or more training on common issues.
Customer satisfaction KPIs at a glance
| KPI | What it measures |
| CSAT (Customer Satisfaction Score) | Customer satisfaction with a product or service |
| NPS (Net Promoter Score) | Likelihood to recommend your brand |
| CES (Customer Effort Score) | Effort required to complete an action |
| Churn Rate | Percentage of lost customers over time |
| FCR (First Contact Resolution) | Issues resolved on first contact |
| CLV (Customer Lifetime Value) | Total revenue from a customer over their lifecycle |
| FRT (First Response Time) | Time a customer waits for the first reply |
| ART (Average Resolution Time) | Time it takes to fully resolve an issue |
| CRR (Customer Retention Rate) | Percentage of customers who stay over a period |
| Repeat Contact Rate | Customers who reach out again about the same issue |
How to Start Tracking Customer Satisfaction
Knowing the formulas is one thing. Building a routine around them is what turns numbers into decisions. Here’s a simple way to set it up.
- Pick a short list. Choose three to five KPIs that match your goals, such as CSAT and FRT for service quality or NPS and CRR for loyalty.
- Survey at the right moments. Send CSAT and CES surveys right after a support interaction, and run NPS on a regular schedule, such as every quarter.
- Bring every channel into one view. A unified inbox like SupportCRM keeps email, voice, and chat in one workspace, so you can see the conversations behind each score.
- Review and act on a set schedule. Give every customer satisfaction KPI an owner, check trends weekly or monthly, and turn each drop into a specific fix.
How Each Customer Satisfaction KPI Connects to Business Performance
In a competitive market, customer satisfaction is now a core concern and central to the success of any business.
With customer satisfaction KPIs, you can assess how well your business is meeting customer expectations while also gaining insight into future business performance. Such correlations include:
Revenue Growth and Customer Loyalty: satisfied customers are more likely to make repeat purchases, try new products, and recommend you to others, all of which means spending less money to acquire new customers.
Cost Efficiency: happy customers are less likely to make returns, cancel services, or call customer support. That translates into money saved on logistics, support, and remarketing.
Brand Reputation and Market Share: brand perception now comes largely from customer experiences. Positive reviews and word of mouth strengthen your reputation and attract new customers. To make the most of these KPIs, businesses should build them into their broader strategy through:
- Regular data collection and analysis
- Cross-departmental integration
- Benchmarking
- A mindset of continuous improvement
When used correctly, KPIs become more than metrics. They turn into strategic assets that shape the bottom line of the business.

Summary
Customer satisfaction KPIs like CSAT, NPS, CES, churn rate, FCR, CLV, first response time, resolution time, retention rate, and repeat contact rate are powerful tools for understanding and improving the customer journey. When used effectively, they drive retention, loyalty, revenue, and overall satisfaction.
You don’t need to track all ten from day one. Start with one customer satisfaction KPI per goal, review it regularly, and add more as your team gets comfortable acting on the data. What looks like simple data on paper can become the competitive edge your business needs in a crowded market.