
“When the data and the anecdotes disagree, the anecdotes are usually right.”
– Jeff Bezos
As a Senior Key Account Manager at SupportYourApp, I’m tempted to lean heavily on customer service metrics and SLAs — Average Handle Time (AHT), First Call Resolution (FCR), Service Level, Customer Satisfaction scores, and so on — to demonstrate performance, efficiency, and quality.
But I’ve learned that there is a real danger in chasing numbers while losing touch with what customers are actually saying, feeling, and experiencing.
In outsourcing contexts, we talk a lot about data-driven approaches: dashboards, efficiency improvements, shrinkage, occupancy, compliance. Yet we often under-value or even overlook the “soft” side — customer stories, Trustpilot complaints, frontline agent feedback, recurring anecdotal themes or even memes on social media of our client’s products or services. Those grey signals aren’t always clean or easy to measure, but they tell us why our CX metrics are misaligned with reality.
My experience suggests that when metrics improve, but customer sentiment doesn’t, the problem isn’t real performance — it’s measurement.
Why Customer Support Metrics Don’t Tell the Whole Story
BPOs often set up KPIs and SLAs with the best intentions for their clients: reduce cost to serve, improve speed, increase throughput, and provide clients with visible proof of efficiency. But there are several common pitfalls:
- Over-optimizing for AHT can lead to rushing customers off the phone, neglecting resolution, or pushing agents to prematurely close interactions. This might create the illusion of efficiency, but it often undermines real problem-solving, increases repeat contact, and degrades customer experience.
- Some BPOs push agents simply to hit numeric targets — finish calls quickly, keep handle times low, avoid overtime. Yet, this way they risk creating behavior that improves the customer service metrics but decreases customer satisfaction and even damages brand reputation.
- Internal dashboards often mask outliers or “failure demand” — calls that are long, complex, or problematic — which may disproportionately shape customer perception. These calls may be rare in volume, but highly visible in customer complaints.
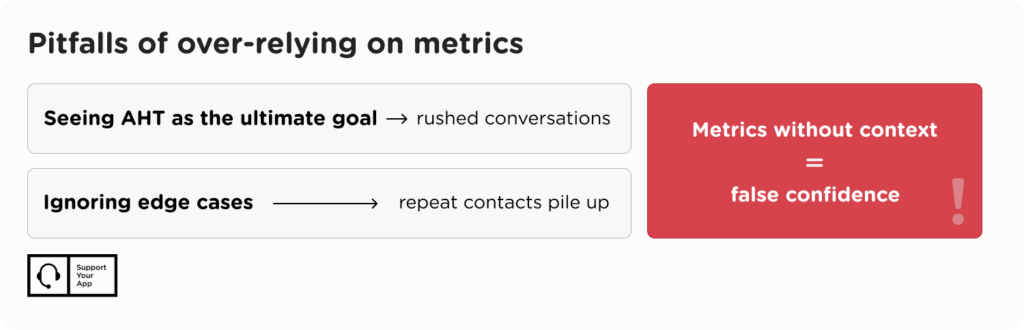
Key Takeaway: Dashboards do not equal reality, so for an accurate picture of your support team performance, couple your customer service performance metrics with real customer insights. Otherwise, great numbers without a context might lead to nothing but false confidence.
Bezos’s “Make the Call” Lesson: Metrics in Customer Service Can Mislead
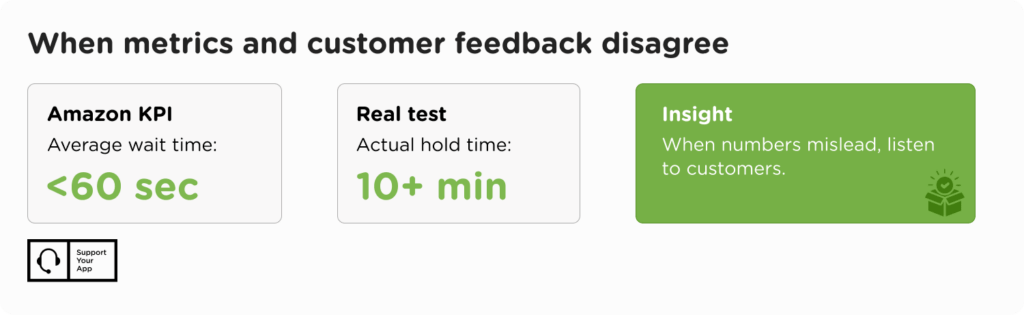
Jeff Bezos’s oft-cited anecdote is a powerful illustration of what happens when numbers don’t match lived experience. Bezos recalled that Amazon’s internal reporting showed phone support wait times of under 60 seconds, yet the company continued to receive numerous customer complaints about long hold times.
To test the metric, he called Amazon’s 1-800 customer service line during a meeting, in front of the customer service leader, and waited in silence for over 10 minutes.
Bezos’s point wasn’t that the data was maliciously wrong, but that Amazon simply wasn’t measuring the right thing. As he put it: “If you have a bunch of customers complaining … and at the same time your metrics look like they shouldn’t be complaining, you should doubt the metrics.”
This isn’t a call to throw out customer service metrics altogether. Rather, it underscores the importance of validating metrics with real-world tests and customer experiences. It’s a reminder that when the data and anecdotes diverge, you need to dig deeper.
Key Takeaway: For BPO leaders, the Bezos experiment is instructive: sometimes you have to “make the call” literally or figuratively, to see whether the performance reports reflect true customer experience.
Anecdotes, Reviews, and Frontline Feedback as Reality Checks
In support outsourcing, there are several qualitative data sources that are often undervalued but can reveal root causes that customer service metrics mask:
- Public reviews (Trustpilot, Google Reviews, app store ratings, social media)
Customers often leave behind rich qualitative feedback that includes frustration, repeated patterns, and emotional cues. These reviews can highlight systemic problems or limitations — confusing product instructions, poor self-service tools, misaligned expectations, or recurring policy frustrations — that a low AHT or high FRT mask. - Repeated “stereotypes” or complaint themes
Customers might talk about the same frustration: “nobody knows how my product works”, “they keep transferring me”, “I always have to ask for a refund”.hose themes should be interpreted as signals of systemic issues, even if your average wait time or resolution rate looks good. - Frontline agent feedback
Agents often feel and see the real customer pain, even if they are being coached to reduce handle time or transfer calls quickly. When agents repeatedly mention that “customers are angry about the policy”, “they’re calling because the documentation is confusing”, or “this process requires too many handoffs”, that feedback is a valuable diagnostic input. - Quality assurance and call/ticket review data
Going beyond time-based metrics, listening to actual call recordings or ticket transcripts and threads can reveal whether issues were fully resolved, whether the customer was satisfied, or whether the agent closed the call or ticket prematurely. This is not just a measure of what happened but how it happened — tone, empathy, clarity, and most importantly, – cues or signals from customers, frontline agents, or interactions — that indicate the real experience behind the customer support metrics. They may be:
- Behavioral indicators (like frustration in tone or repeated follow-ups),
- Operational clues (e.g. escalations, repeated contacts),
- Experience-level inconsistencies (e.g. complaints vs. dashboards data).

So, Bezos noticed a customer cue that contradicted the quantitative metric (the average wait time KPI). The cue exposed a blind spot in measurement.
Most QA programs rely heavily on metrics:
- Average handle time (AHT)
- First contact resolution (FCR)
- CSAT or NPS
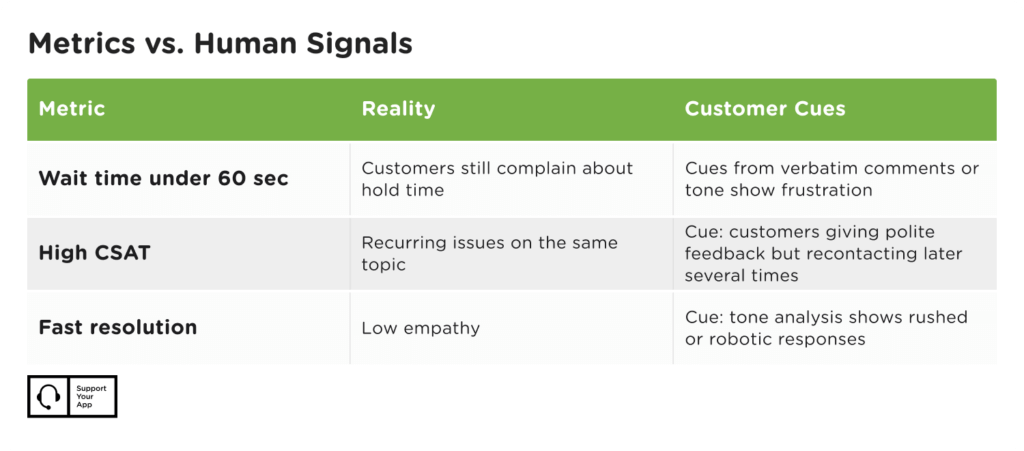
But these metrics can mask patterns that are visible only through cues — subtle, human signals in qualitative data.
Examples of Customer Service Metrics vs. Customer Cues
The Danger of Oversimplified CSAT
Another area where metrics can easily mislead is Customer Satisfaction (CSAT) surveys. Both clients and BPOs often chase two things:
- Simplified, “easy-to-use” forms
- In practice, this often means single-question surveys like “How satisfied are you with this interaction?” with a 1–5 or smiley-face scale.
- While simple, these forms risk directing the customer into giving a superficial score. They rarely capture nuance — why the customer felt the way they did, or what could have been improved.
- The result: leadership gets a “clean” number, but misses the story behind it.
- In practice, this often means single-question surveys like “How satisfied are you with this interaction?” with a 1–5 or smiley-face scale.
- Response rate as a KPI
- Many organizations set targets for “survey completion percentage” (e.g. 20% of all interactions should return a CSAT score).
- This creates pressure to maximize responses rather than insights. Agents may prompt only happy customers to fill out surveys, or systems may send overly simplified prompts to inflate participation.
- Research shows average post-call survey response rates are typically 5-10%, meaning the majority of customers don’t provide feedback at all. Chasing quantity can distort the picture further.
- Many organizations set targets for “survey completion percentage” (e.g. 20% of all interactions should return a CSAT score).
The danger is clear: companies end up with inflated scores that “look good” on reports but don’t reflect reality. They might proudly present a 90% CSAT, yet be unaware of unresolved frustrations showing up in Trustpilot, Google Reviews, or social media complaints and eventually becoming hot memes of the week.
To avoid this trap, BPOs and clients should:
- Design CSAT forms with open-text options to capture context.
- Or use micro-CSAT or emoji feedback in-flow while still solving the ticket for them or a phone call. Let customers rate the experience mid-interaction (e.g., “Was this helpful? 😊 😐 😞”) — short, frictionless, real-time.
- Balance quantitative scores with qualitative insights that match the customer’s feedback provided in other sources. Create a “safe feedback path” within the product or post-interaction message:
- “Didn’t like the support? Tell us here first.”
- Fast escalation to quality assurance or CX team before it spills to social media.
- Avoid setting arbitrary targets for “response volume” — and instead focus on trends, root causes, and recurring themes in feedback. Use relational or periodic CSAT surveys. Instead of relying only on transactional surveys, run short pulse surveys quarterly or monthly to get a broader view of satisfaction — especially for retained or enterprise clients.
- Treat low response rates not as failure but as a signal: perhaps customers don’t feel feedback matters, or the survey design doesn’t invite engagement.
Key Takeaway: a simplified one-time CSAT survey might make reporting easier, but it also makes insights weaker.
From Cosmetic Fixes to Root-Cause Improvement
If you don’t listen to the memes and anecdotes about your products, you risk implementing superficial fixes that patch up visible symptoms but leave deeper problems unaddressed:
- Lowering AHT by telling agents to hang up as soon as you have that possibility doesn’t help if customers are calling back. Worse, it can increase repeat contacts and customer time and effort.
- Hitting FRT targets by closing cases quickly may reduce the number of repeat calls/emails/chats — but not necessarily customer dissatisfaction — if customers are unhappy or issues resurface, we’re back to square one.
- Improving service-level percentages (e.g. answering 80% of calls within 30 seconds) may look good on dashboards but create frustration if the remaining 20% of calls are those from the most frustrated customers spreading negativity over all social media platforms — or if callers/customer spend a long time in self-service menus before getting to the queue.
In these cases, teams may be lauded for “meeting KPIs”, while trust erodes, brand reputation suffers, and clients complain. The result is cosmetic improvement — better-looking dashboards but worse customer sentiment.
Instead, leaders should review and use memes, stories, social media posts and “anecdotal” feedback and customer-centric reviews to ask: Why aren’t customers satisfied? Only then can we implement root-cause improvements — better documentation, clearer policies, improved training, elimination of failure demand, cross-departmental process alignment — that truly reduce customer effort, not just response times.
Leadership’s Role: From Customer Service Metrics Manager to Reality Verifier
As a Senior Key Account Manager, I believe your most important job isn’t just pushing metrics — it’s concentrating on those metrics matches the reality and perception of the brand you support. That means:
- Testing and verifying metrics: Just like Bezos made the test call, we should periodically test our own SLAs — making mystery shopper/secret customer calls, reviewing random customer journeys, or directly sampling customer experiences through different platform where the feedback was left to validate what the dashboards are showing.
- Encouraging a culture of “disconfirming evidence”: Instead of celebrating only those signals that confirm KPIs, we should reward team members (and especially Team Leads, Product Experts) who bring up “disconfirming stories” — customer complaints, negative feedback, or agent observations that suggest our metrics might be misleading.
- Balancing quantitative KPIs with qualitative reviews: Use metrics like AHT, FRT, CSAT, and Service Level in concert with headline customer feedback, review data, sentiment analysis, and complaint archetypes. One without the other gives an incomplete picture.
- Digging to root causes and cues: When metrics look good, but customer satisfaction doesn’t, ask why. What is driving the gap? What is the system failing to measure? What processes, product issues, or policy frustrations are causing negative public image? Then intervene upstream.
- Communicating honestly with clients and teams: When our SLAs are technically being met, but customers are still unhappy, it’s better to surface that reality early than to hide behind dashboard metrics. Transparency and trust is the must in BPO industry — both with clients and with our frontline teams.
Conclusion: The Real Cost of Ignoring Anecdotes
In the BPO and service delivery world, obsessively optimizing KPIs without grounding them in customer stories and frontline reality can lead to lost trust, higher failure demand, frustrated customers, and burned-out agents. In other words: perfect dashboards, unhappy customers, and missed root causes.
What are customer service metrics? These are measurable indicators like Average Handling Time, Customer Satisfaction score, or resolution rate, that show how effectively a team supports and satisfies customers.
Metrics are essential — but they are not gospel. Customer-facing businesses that succeed are those that treat anecdotes, reviews, complaint patterns, and agent feedback not as noise, but as diagnostic data. Because when the numbers and the stories diverge, it’s the stories that point us to what’s really going wrong — and how to fix it.
And this doesn’t just help operations. When social media memes and anecdotes are heard and acted upon, it also empowers the teams responsible for lead generation, brand awareness, and social media presence. Why? Because stereotypes, memes, and customer jokes — even the negative ones — are powerful signals. When marketing and brand teams address these perceptions directly, they build authenticity, trust, and stronger engagement.
❤︎ Like it? — Share: Share on LinkedIn or Share on Facebook

Daniel is a Service Delivery Director at SupportYourApp. Before joining the team, he lived and worked in the United States, bringing over 5 years of experience in managing client relationships in the Educational recruitment sector. His Technical and International Business degrees have allowed him to successfully manage Fintech and Crypto-related projects. Currently, he holds the position of Senior Key Account Manager and is responsible for the Key Client vertical management at the company. A passionate traveler, Daniel has explored 48 out of 50 U.S. states over the past decade — always eager to discover new places and cultures.
Posted on LinkedIn